PROJECT:
THE GAS TURBINE BURNER CHARACTERIZATION
· UNIGE - ENERGY LAB ·
[email protected]
The aerodynamic characterization of the Ansaldo burner AE64.3A involves conducting performance tests under atmospheric operating conditions. These tests aim to analyze and understand the flame characteristics, flame shape, flames distribution within the combustor, and the presence of OH radicals. One aspect of the characterization process involves flame mapping of OH radicals, which provides insights into the flame's shape, characteristics, and distribution within the combustor. This mapping helps in understanding the combustion process and optimizing burner performance. Additionally, numerical simulations are performed to test the operational conditions that were experimentally tested. These simulations utilize computational models and algorithms to simulate the flow, combustion, and heat transfer processes occurring within the burner. By numerically testing the previously experimented conditions, researchers can further analyze and optimize the burner's performance and operational parameters. Overall, the aerodynamic characterization of the Ansaldo burner AE64.3A involves a comprehensive approach that combines experimental performance testing, flame mapping of OH radicals, and numerical simulations to gain a deep understanding of the burner's behavior and optimize its operational conditions.
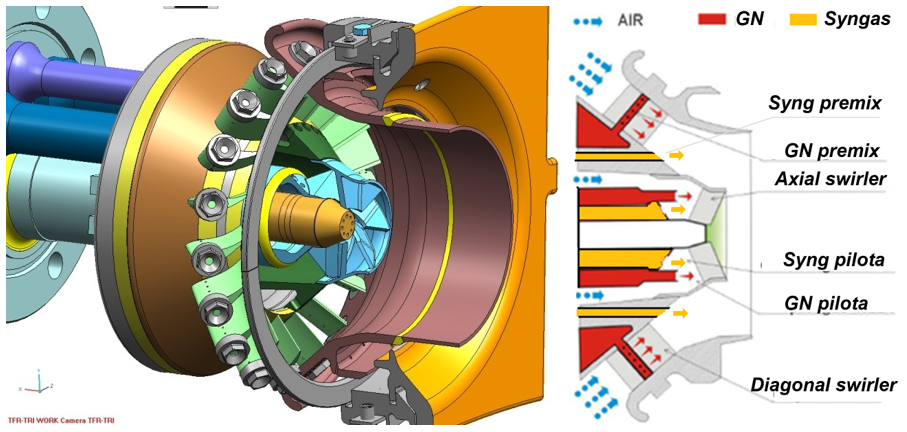
Figure1. AE64.3A burner configuration showcasing its ability to achieve optimal air-fuel mixture through the utilization of axial and diagonal swirlers, enabling combustion in close proximity to the burner's outlet. This burner is designed to operate with both natural gas and syngas as fuels.
PIV (Particle Image Velocimetry) is a powerful measurement technique used to investigate fluid flow behavior in a specific area. It allows for the evaluation of velocity components within a desired volume of a plane. By capturing two sequential photographs of a surface illuminated by a laser sheet, the PIV method enables the computation of fluid velocity components through cross-correlation analysis. In order to visualize the flow, a fog or smoke generator, such as a fog machine, is employed during experiments. While a single CCD camera can calculate two velocity components, the use of two CCD cameras allows for the evaluation of the third velocity component. The PIV system consists of essential components. A laser source is required to generate a laser sheet, which can be achieved using appropriate optics to shape the initially cylindrical laser light. CCD cameras are utilized for data collection, and a synchronizer ensures the synchronization of input data with the acquisition system.
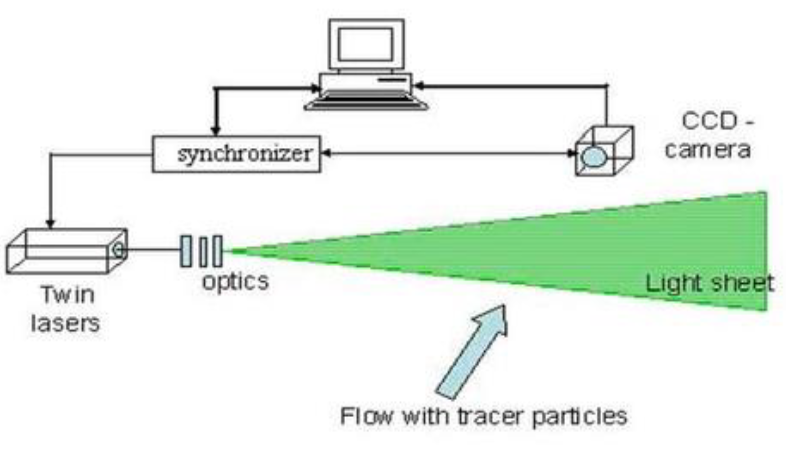
Figure2. Single camera PIV setup.
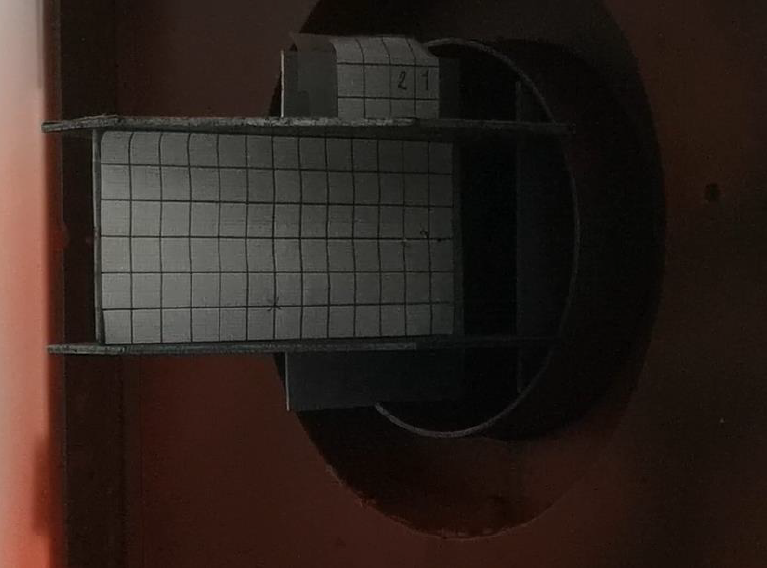
Figure3. Reference part (target) for CCD camera adjustment.
In addition to PIV, hot wire acquisition is another commonly used technique in fluid flow measurement. Hot wire anemometry utilizes a heated wire probe to measure the velocity of a fluid by monitoring changes in wire resistance due to convective cooling. It provides high-resolution velocity measurements and is often used in turbulent flow studies.
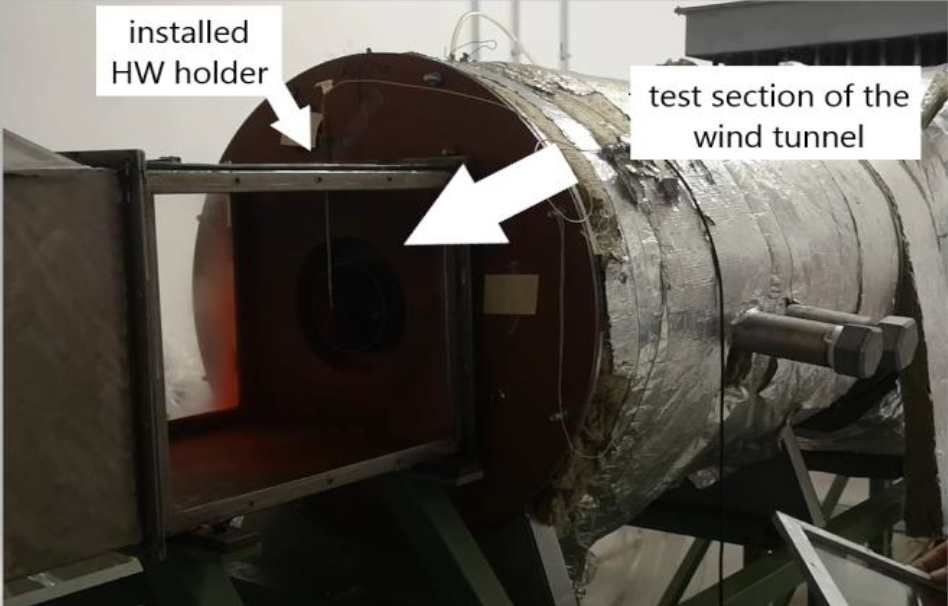
Figure4. HW holder installation into the test section.
Once all the devices are properly set up, data collection can commence. The HW (hot wire) acquisition generates analog data, which is then stored in a designated folder. To measure this data, a tachometer is utilized. Furthermore, the TTL acquisition, responsible for triggering the data acquisition system, has a duration of 0.05 seconds. To identify periodic oscillations in the tachograph text files, it is necessary to consider values 0.02 seconds before and after each TTL signal. By calculating the time difference between two consecutive TTL signals, the period of PIV acquisition can be determined. Following data acquisition, the next step involves data cleansing and analysis using MATLAB. The collected data is processed and analyzed to extract relevant information and insights. Additionally, vector field visualization techniques are employed to represent the flow patterns and structures present in the data. This visualization aids in the interpretation and understanding of the flow characteristics. As a final step, the phase-locked averages are computed based on the data. Typically, ten phases are chosen for analysis to capture various flow patterns. It is worth noting that the resulting data is mirrored to enhance visibility and facilitate the interpretation of flow structures.
During the analysis of the flow field, distinctive jet formations can be observed in darker regions. Additionally, the presence of an internal cone shape indicates the existence of a recirculation zone within the flow. Vortex structures are also typically visible at the burner outlet, indicating complex fluid dynamics at that location.